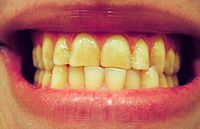
Photo from wikipedia
Importance Research in facial aging has focused on soft-tissue changes rather than bony changes despite evidence of the importance of underlying bony structural changes. Research has also been limited by… Click to show full abstract
Importance Research in facial aging has focused on soft-tissue changes rather than bony changes despite evidence of the importance of underlying bony structural changes. Research has also been limited by comparing different patients in separate age groups rather than the same patients over time. Objective To longitudinally document patterns of change in the facial skeleton and determine a consistent methodology for measuring these changes. Design, Setting, and Participants Case series study of university hospital system records using facial computed tomographic (CT) images timed at least 8 years apart in adults initially aged 40 to 55 years with no history of facial surgery who required repeated facial imaging that included the entire midface and cranium. Main Outcomes and Measures Face CTs were analyzed for 3-dimensional constructions and 2-dimensional measurements to document changes in glabellar, piriform, and maxillary angles and piriform height and width. Results Fourteen patients (5 men, 9 women; mean [SD] age, 51.1 [5.8] years) with mean (SD) follow-up of 9.7 (1.4) years were eligible for 2-dimensional analysis, which revealed statistically significant decreases in mean (SD) glabellar angles (from 68.8° [7.6°] to 66.5° [8.6°]) and maxillary angles on both the right (from 82.5° [6.3°] to 81.0° [7.1°]) and left (from 83.0° [5.8°] to 81.0° [7.0°]), as well as increases in mean (SD) piriform width (from 24.5 [1.6] mm to 25.5 [1.3] mm). Nine patients (3 men, 6 women; mean [SD] age, 51.4 [6.3] years) with mean (SD) follow-up imaging at 9.6 (1.5) years were eligible for 3-dimensional analysis, which revealed statistically significant decreases in mean (SD) maxillary angles (from 56.5° [6.6°] to 51.6° [7.6°]) and piriform angles (from 50.8° [3.4°] to 49.1° [3.4°]). Statistically significant differences between the sexes were also noted: Initial mean (SD) glabellar angle for men was 61.7° (5.7°) vs 72.7° (5.4°) for women, with final values of 57.9° (4.9°) vs 71.2° (6.0°). Mean (SD) maxillary angle initial values were 87.8° (6.1°) (right) and 87.1° (4.9°) (left) for men, with 79.6° (4.3°) and 80.6° (5.0°) for women, respectively. Final values were 87.0° (4.4°) and 86.9° (4.1°) for men and 77.7° (6.1°) and 77.7° (6.2°) for women, respectively. Mean (SD) piriform height for men was 35.0 (2.0) mm initially and 35.5 (2.1) mm finally, vs 31.3 (2.8) and 31.6 (3.0) mm for women, respectively. Conclusions and Relevance Our pilot study of repeated CT images of patients over several years supports previous studies of bony facial aging and further characterizes these changes. This study is the first, to our knowledge, to document bony changes of the face in the same group of patients at different time points to better characterize facial aging. We also detail an improved methodology to study bony aging to contribute to additional research in the field. Level of Evidence NA.
Journal Title: JAMA Facial Plastic Surgery
Year Published: 2017
Link to full text (if available)
Share on Social Media: Sign Up to like & get
recommendations!