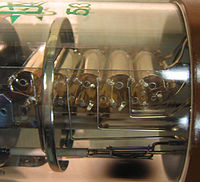
Photo from wikipedia
The characterization of flow cytometer instrument performance can be used to help design and execute better assays but involves technical complexities that have their roots in the instrument hardware and… Click to show full abstract
The characterization of flow cytometer instrument performance can be used to help design and execute better assays but involves technical complexities that have their roots in the instrument hardware and software. A recent publication that described the characterization of a commercial flow cytometer measuring uniform light pulses provides an opportunity to discuss some of these complexities. Published in November 2017, the publication “Determination of Background, Signal-to-Noise, and Dynamic Range of a Flow Cytometer: A Novel Practical Method for Instrument Characterization and Standardization” by Giesecke et al. appeared in Cytometry Part A. (1) Over the last 2 years, the publication has generated many questions by users who have been unsuccessful in repeating the procedures described. They have repeatedly turned to me and others to help clarify what they might be doing wrong. The questions and answers to these inquiries have focused on a few central points of data collection and data analysis that were not adequately described in the abovementioned publication. Instead of continuing to field these questions individually and to help the flow cytometry community at large, it seemed that a more comprehensive and far-reaching approach would be to address these points in Cytometry Part A. Toward this end, the following is a compilation of recommendations that will help users achieve a greater success in measuring the background, signal-to-noise, and dynamic range of their flow cytometer(s).
Journal Title: Cytometry Part A
Year Published: 2019
Link to full text (if available)
Share on Social Media: Sign Up to like & get
recommendations!