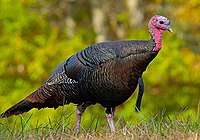
Photo from wikipedia
Abstract The “green wave” hypothesis posits that during spring consumers track spatial gradients in emergent vegetation and associated foraging opportunities. This idea has largely been invoked to explain animal migration… Click to show full abstract
Abstract The “green wave” hypothesis posits that during spring consumers track spatial gradients in emergent vegetation and associated foraging opportunities. This idea has largely been invoked to explain animal migration patterns, yet the general phenomenon underlies trends in vertebrate reproductive chronology as well. We evaluated the utility of this hypothesis for predicting spatial variation in nest initiation of greater sage‐grouse (Centrocerus urophasianus), a species of conservation concern in western North America. We used the Normalized Difference Vegetation Index (NDVI) to map the green wave across elevation and then compiled dates and locations of >450 sage‐grouse nests from 20 study sites (2000–2014) to model nest initiation as a function of the start of the growing season (SOS), defined here as the maximum daily rate of increase in NDVI. Individual sites were drawn from three ecoregions, distributed over 4.5° latitude, and spanning 2,300 m in elevation, which captured the climatic, edaphic, and floristic diversity of sagebrush ecosystems in the southern half of current sage‐grouse range. As predicted, SOS displayed a significant, positive relationship with elevation, occurring 1.3 days later for each 100 m increase in elevation. In turn, sage‐grouse nest initiation followed SOS by 22 ± 10 days (r2 = .57), with hatch dates falling on or just prior to the peak of the growing season. By timing nesting to the green wave, sage‐grouse chicks hatched when the abundance of protein‐rich invertebrate biomass is hypothesized to be nearing a seasonal high. This adaptation likely represents a strategy for maximizing reproductive success in the arid, variable environments that define sagebrush ecosystems. Given projected changes in climate and land use, these results can be used to predict periods of relative sensitivity to habitat disturbance for sage‐grouse. Moreover, the near real‐time availability of satellite imagery offers a heretofore underutilized means of mapping the green wave, planning habitat restoration, and monitoring range conditions.
Journal Title: Ecology and Evolution
Year Published: 2020
Link to full text (if available)
Share on Social Media: Sign Up to like & get
recommendations!