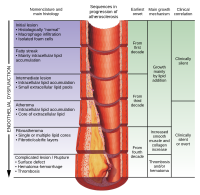
Photo from wikipedia
BACKGROUND Vascular calcifications (VCs) may be a prognostic factor for outcome after endovascular treatment of peripheral arterial disease (PAD). Semiquantitative analysis with X-ray imaging is the main limiting factor for… Click to show full abstract
BACKGROUND Vascular calcifications (VCs) may be a prognostic factor for outcome after endovascular treatment of peripheral arterial disease (PAD). Semiquantitative analysis with X-ray imaging is the main limiting factor for assessing VCs. The aim of the present study was to find a correlation between the amount of VC with computed tomography (CT) scan quantification and midterm results of endovascular treatment of Trans-Atlantic Inter-Society Consensus C/D femoropopliteal (FP) lesions. METHODS Patients belonging to 2 previously published registries (STELLA and STELLA PTX) and who underwent a preoperative CT scan were retrospectively included in the study. VC quantification was performed with a dedicated workstation (EndoSize, Therenva) on the basis of Hounsfield units (HU). The VC percentage was calculated as the ratio between VC volume and the volume of the region of interest. For the analysis, patients were divided into 3 groups according to VC percentage, from lowest to highest: group 1 (G1) included the first quartile of VCs, group 2 (G2) included the second and third quartiles, and group 3 (G3) included the fourth quartile. Risk of in-stent thrombosis was analysed using a multivariate model. RESULTS Thirty-nine patients were included (10 in G1, 19 in G2, and 10 in G3), and mean follow-up duration was 24 ± 14.6 months. Patients in G1 and G3 had, respectively, a VC rate of <1% (no VC) and >20% (severe VC). In G2, VC was considered to be intermediate. There was no statistical difference in the cardiovascular risk factors and preoperative medication. A significant difference was found for the healthy FP diameter between G1 (4.6 ± 0.8 mm) and G3 (6.8 ± 0.8 mm, P < 0.0001) and between G2 (5.2 ± 1 mm) and G3 (P < 0.0001). The rate of drug-eluting stents was similar in all groups. There was no difference between groups concerning the rate of in-stent restenosis, target lesion revascularization, and target extremity revascularization. There was a higher rate of in-stent thrombosis for G1 versus G2 (P = 0.037), and no difference was noted between G1 versus G3 (P = 0.86) or G2 versus G3 (P = 0.12). G3 was associated with early stent thrombosis (<1 month), while G1 was associated with late stent thrombosis (6-24 months). On multivariate analysis, only one predictive factor for stent thrombosis was found: patients with intermediate VC seemed to be protected against in-stent thrombosis (odds ratio = 0.27, 95% confidence interval: 0.1-0.77; P = 0.014). CONCLUSIONS The study showed that VC quantification with CT imaging is feasible and useful for comparing outcomes following PAD endovascular revascularization. Below a certain threshold, the presence of VC might be necessary for plaque stability and may protect against in-stent thrombosis.
Journal Title: Annals of vascular surgery
Year Published: 2018
Link to full text (if available)
Share on Social Media: Sign Up to like & get
recommendations!