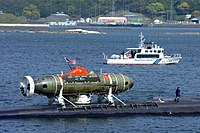
Photo from wikipedia
Abstract In a present experiment, a solid sphere with a density of 2.64 × 10³ kg/m3 and diameter of 25.4 mm was launched vertically upward in water toward the air–water interface.… Click to show full abstract
Abstract In a present experiment, a solid sphere with a density of 2.64 × 10³ kg/m3 and diameter of 25.4 mm was launched vertically upward in water toward the air–water interface. The submergence depth was changed and the launch velocity was adjusted so that the Reynolds number of the sphere immediately after passing the air–water interface was almost equal at each submergence depth. The effects of the submergence depth on the motion of the sphere and behavior of the air–water interface were investigated, which indicated that the Reynolds number immediately after the sphere passed through the air–water interface was R e ¯ w 1 ∼ 3000 at all submergence depths ( 1 . 0 d ≤ H ≤ 6 . 0 d ; d is the diameter of the sphere and H is the submergence depth). The experimental values of the maximum displacement position were always smaller than the theoretical values owing to the energy dispersion caused by the water droplets entrained around the sphere. When the submergence depth was H ∕ d 3 , the higher the submergence depth, the smaller was the rise of the sphere after passing through the air–water interface. However, when the submergence depth was H ∕ d ≥ 3 , the temporal changes in the vertical trajectory of the sphere were approximately equal. The energy ratio E p ∕ E k was defined as the ratio of the kinetic energy E k of the sphere immediately after it passed through the air–water interface to the potential energy E p when the sphere reached the maximum displacement position. E p ∕ E k decreased when the submergence depth was H ∕ d 3 ; however, it had a constant value of E p ∕ E k ∼ 0 . 57 ± 0 . 05 when the submergence depth was H ∕ d ≥ 3 . In addition, when the submergence depth was H ∕ d ≥ 3 , the ratio of each energy (kinetic energy, potential energy, and interfacial energy) became similar immediately after passing through the water surface. This indicated that each energy distribution had reached the equilibrium state. These findings contribute to the determination of variable parameters when modeling the water exit problem.
Journal Title: Ocean Engineering
Year Published: 2020
Link to full text (if available)
Share on Social Media: Sign Up to like & get
recommendations!