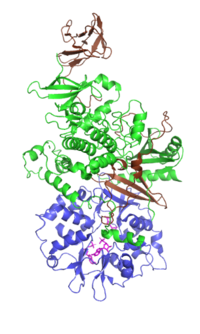
Photo from wikipedia
This study aimed to characterize the full-length cDNA of AMP-activated protein kinase α1 (AMPKα1) from Megalobrama amblycephala and investigate the transcriptional response of this kinase to nutrient restriction and glucose… Click to show full abstract
This study aimed to characterize the full-length cDNA of AMP-activated protein kinase α1 (AMPKα1) from Megalobrama amblycephala and investigate the transcriptional response of this kinase to nutrient restriction and glucose and insulin loadings. The cDNA obtained was 3545-bp long with an open reading frame of 1710 bp encoding 570 amino acids. Multiple alignments and phylogenetic analyses revealed a high degree of conservation (80-100%) among most fish, retaining one kinase domain (KD), one auto-inhibitory domain (AID), one C-terminal domain (α-CTD), one regulatory-subunit-interacting motif (α-RIM), one serine/threonine-rich loop (ST loop), one α-hook, and several phosphorylation sites. AMPKα1 mRNA was predominantly expressed in white muscle, gill, and brain tissues, whereas little was expressed in the intestines. After a fasting-refeeding trial, phosphorylation and mRNA levels of AMPKα1 were significantly greater in fish fasted for 10 days, while in re-fed fish at 1 h after re-feeding, the levels of this kinase were intermediate between those of the fish in the fed and fasted groups. Further, AMPKα1 mRNA levels were quantified in the liver and muscle tissues of fish injected intraperitoneally with 1.67 g glucose per kg body weight and 0.052 mg insulin per kg body weight, respectively. Glucose and insulin administration resulted in a significant decrease in AMPKα1 expression in both tissues with minimum values attained at 2 h and 4 h after injection, respectively. Thereafter, the expression increased significantly to the basal value at 24 h after injection, except in the liver in which the maximum value was obtained at 12 h post-glucose injection. Overall, AMPKα1 of M. amblycephala was similar to that of other vertebrates, and nutrient restriction modified its phosphorylation and mRNA levels in liver and muscle tissues. Furthermore, substantial expression of this kinase was induced in both liver and muscle tissues by glucose and insulin administration.
Journal Title: General and comparative endocrinology
Year Published: 2018
Link to full text (if available)
Share on Social Media: Sign Up to like & get
recommendations!