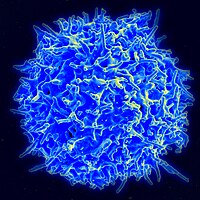
Photo from wikipedia
Deciphering how T-cell antigen receptor signals are modulated by coinhibitors is a fundamental goal in immunology and of considerable clinical interest because blocking coinhibitory signals via therapeutic antibodies have become… Click to show full abstract
Deciphering how T-cell antigen receptor signals are modulated by coinhibitors is a fundamental goal in immunology and of considerable clinical interest because blocking coinhibitory signals via therapeutic antibodies have become a standard cancer immunotherapeutic strategy. Most of the attention devoted to T-cell immunoglobulin and mucin domain-3 (TIM3; also known as HAVCR2 or CD366) molecules stems from their expression on exhausted T cells in settings of chronic viral infection and tumors. Moreover, T cells expressing high levels of both PD-1 and TIM3 coinhibitors appear more dysfunctional than those expressing PD1 alone. Combination therapies intending to block both PD-1 and TIM3 are thus actively being explored in the cancer treatment setting. Upon interaction with Galectin-9 (GAL-9) and carcinoembryonic antigen-related cell adhesion molecule 1 (CEACAM-1), the tyrosines found in the TIM3 cytoplasmic tail are phosphorylated. Because these conserved tyrosines do not form a recognizable inhibitory signaling motif, the mechanism by which TIM3 transmits inhibitory signals has not been elucidated. Paradoxically, TIM3 also has costimulatory activity in T cells. Published biochemical studies attempting to unveil the mode of action of TIM3 have relied on approaches addressing one candidate effector at a time with limited quantitative insight, and most used transformed cells. Using mice expressing an affinity TwinStrep-tag (OST) at the TIM3-protein C-terminus (TIM3 mice) (Figs. 1a and S1a) and affinity purification coupled with mass spectrometry (AP-MS), we herein defined the composition and dynamics of the signaling protein complex (signalosome) used by TIM3 in primary effector T cells. These results provide a more complete model of TIM3 signaling and explain its paradoxical coinhibitory and costimulatory functions. Normal numbers of T cells were present in TIM3 mice, and they proliferated appropriately in response to TCR stimulation (Fig. S1b, c). Following a brief in vitro expansion and restimulation with anti-CD3 and anti-CD28 antibodies, CD4 T cells from TIM3 mice expressed levels of TIM3 comparable to those in their wildtype (WT) counterparts (Figs. 1b, c and S1d). Consistent with the presence of extensive N-glycosylation, treatment of affinitypurified TIM3-OST molecules with glycopeptidase F reduced their molecular weight (Fig. S1e). Therefore, CD4 effector T cells from TIM3 mice expressed proper TIM3 molecules. Considering that the interaction of TIM3 with GAL-9 and CEACAM-1 remains controversial, the effector CD4 T cells subjected to AP-MS were activated with pervanadate to trigger the phosphorylation of TIM3 tyrosines. After activation with pervanadate, TIM3 and WT CD4 effector T cells showed similar patterns of inducible tyrosine phosphorylation (Fig. 1d). As expected, TIM3-OST molecules were affinity-purified from TIM3 samples and showed robust levels of tyrosine phosphorylation after pervanadate stimulation (Fig. 1e). To identify and quantify the proteins (“the prey”) associated with TIM3-OST molecules (“the bait”) over the course of pervanadate stimulation, CD4 effector T cells that expressed TIM3-OST molecules were left untreated or treated for 30, 120, 300, and 900 s with pervanadate (Fig. 1f). To distinguish true TIM3interacting proteins from nonspecific contaminants, we compared our data with those of control AP-MS experiments involving WT CD4 T cells that were subjected to the same expansionrestimulation protocol as TIM3 CD4 T cells and expressed comparable levels of untagged TIM3 molecules (Fig. 1c). For each time point, three independent biological replicates were performed, and the proteins copurifying with TIM3 were analyzed by MS. We identified 37 high-confidence TIM3 prey proteins that showed a greater than tenfold enrichment with a p value below 0.005 in at least one of the five conditions of stimulation (Fig. 1f and Supplementary dataset 1). Among them, 11 prey proteins (RPS4X, GRB2, ERP44, MTHFD, CBLB, GIMAP7, ISYNA1, VAV1, SHP1 (also known as PTPN6), UBASH3A (also known as STS-2), and RAVER1 showed interaction stoichiometries that changed at least fivefold following pervanadate stimulation (Fig. 1g). Importantly, all 11 activation-regulated TIM3 prey proteins corresponded to novel TIM3 interactors. Analysis of interaction stoichiometries over the course of stimulation further showed that most of the activation-inducible prey proteins bound to TIM3 after 30–120 s of activation (Fig. 1h). We had to slightly relax our stringent cutoff values to identify previously reported TIM3 interactors. All these known interactors constitutively bound to TIM3 and corresponded to the p85α subunit of phosphoinositide 3-kinase (P85A; 10-fold enrichment, p value: 2.5 × 10), the chaperone BAT3 (BAG6; 8.7-fold enrichment, p value: 9.0 × 10), and the protein tyrosine kinase LCK (8.5-fold enrichment, p value: 3.0 × 10) (Fig. 1i and S2; Supplementary
Journal Title: Cellular and Molecular Immunology
Year Published: 2020
Link to full text (if available)
Share on Social Media: Sign Up to like & get
recommendations!