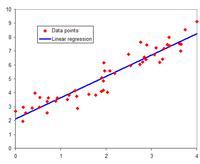
Photo from wikipedia
At the core of multivariate statistics is the investigation of relationships between different sets of variables. More precisely, the inter-variable relationships and the causal relationships. The latter is a regression… Click to show full abstract
At the core of multivariate statistics is the investigation of relationships between different sets of variables. More precisely, the inter-variable relationships and the causal relationships. The latter is a regression problem, where one set of variables is referred to as the response variables and the other set of variables as the predictor variables. In this situation, the effect of the predictors on the response variables is revealed through the regression coefficients. Results from the resulting regression analysis can be viewed graphically using the biplot. The consequential biplot provides a single graphical representation of the samples together with the predictor variables and response variables. In addition, their effect in terms of the regression coefficients can be visualized, although sub-optimally, in the said biplot.
Journal Title: Journal of Applied Statistics
Year Published: 2019
Link to full text (if available)
Share on Social Media: Sign Up to like & get
recommendations!