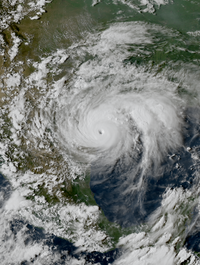
Photo from wikipedia
ABSTRACT Harvey was one of the worst hurricanes that hit the Gulf coast in recent history, causing severe loss of lives and property through excessive precipitation and flooding. In the… Click to show full abstract
ABSTRACT Harvey was one of the worst hurricanes that hit the Gulf coast in recent history, causing severe loss of lives and property through excessive precipitation and flooding. In the present study we have carried out analysis of satellite data and high-resolution models to understand the physical processes that led to the development and intensification of hurricane Harvey as it made landfall and progressed inwards. We have studied horizontal and vertical changes in meteorological parameters, along the track of the hurricane Harvey to understand the intensification and spatial distribution of high precipitation. Maximum intensity of the storm was observed on 26 August; however the most intense precipitation occurred on 27 August that was caused by the slowing down of Harvey. Our detailed analysis shows contrasting storm intensity between the two sides of the storm, one along the direction of storm motion and the other along the trailing side, which has been shown to be the primary driver for the distribution of precipitation and its variation in intensity.
Journal Title: Remote Sensing Letters
Year Published: 2018
Link to full text (if available)
Share on Social Media: Sign Up to like & get
recommendations!