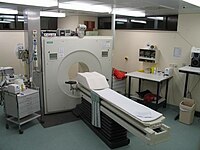
Photo from wikipedia
Contrast-induced nephropathy (CIN) is an major complication of enhanced computed tomography(CT) procedures.Development of CIN after enhanced CT may lead to worse clinical outcomes. Thus, markers are used to identify the… Click to show full abstract
Contrast-induced nephropathy (CIN) is an major complication of enhanced computed tomography(CT) procedures.Development of CIN after enhanced CT may lead to worse clinical outcomes. Thus, markers are used to identify the risk of patients ,who undergo enhanced CT with CIN.Red cell distribution width(RDW) is a measurement of erythrocyte variability and heterogeneity, and it is obtained routinely in standard complete blood cell counts.Current researches indicate that RDW is the independent predictor of AKI after patients receiving percutaneous coronary intervention (PCI).However, the correlation of RDW and CIN after enhanced CT are yet to be determined.In this study we investigated whether RDW levels correlate with development of CIN in patients after enhanced CT. A total of 633 patients undergoing enhanced CT from June 2015 to June 2018 at Huizhou Central Municipal Hospital were enrolled. Patients were divided into CIN group and no-CIN group. The diagnostic criteria for CIN is an increase in serum creatinine(Scr) more than 44.2μmol/L or 25% higher than the baseline value within 72 hours after contrast administration. The study population consisted of 633 patients ,25(3.95%) patients developed into CIN. Patients who got CIN were older and had a higher prevalence of active smoking compared with those were without CIN. The range of the baseline serum creatinine and red cell distribution width was significantly higher in CIN groups.However,baseline eGFR,red blood cell counts,hemoglobin and albumin levels were significantly lower in patients who developed CIN(all P<0.05).Multivariate logistic regression analysis revealed that baseline RDW level(OR=2.325,95% CI 1.521∼3.556,P<0.001),albumin(OR=0.888,95%CI 0.803∼0.982, P=0.021)and eGFR(OR=0.921,95%CI 0.849∼0.999,P=0.047)were independent risk factors in the development of CIN in patients after enhanced computed tomography.The area under the ROC curve for RDW was 0.803(95% CI 0.706∼0.900,p<0.001),and an RDW of 13.85% or higher predicted CIN with a sensitivity of 72% and specificity of 75.80%(Figure 1). Increased baseline of RDW, decreased eGFR and lower albumin are independently related with a higher risk of CIN in patients undergoing enhanced CT.RDW is possibly a predictive biomarker for the early diagnosis of CIN.
Journal Title: Nephrology Dialysis Transplantation
Year Published: 2020
Link to full text (if available)
Share on Social Media: Sign Up to like & get
recommendations!