Photo from wikipedia
Abstract Background Before implementation of rotavirus vaccination in 2006, rotavirus caused 55,000-70,000 hospitalizations and 410,000 clinic visits annually in US children. This report examines the long-term impact of vaccine introduction… Click to show full abstract
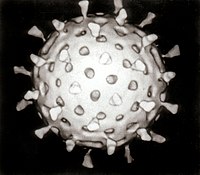
Abstract Background Before implementation of rotavirus vaccination in 2006, rotavirus caused 55,000-70,000 hospitalizations and 410,000 clinic visits annually in US children. This report examines the long-term impact of vaccine introduction on rotavirus detection and seasonality through comparison of pre (2000–2006) and post (2007–2016) vaccine seasons through the National Respiratory and Enteric Virus Surveillance System (NREVSS). Methods NREVSS is a passive laboratory system collecting results of weekly total and rotavirus-positive stool specimens. Seasons are defined as July through June. To characterize changes in rotavirus detection, total and positive specimens for each post vaccine season from 11 continuously reporting (≥26 weeks per season) laboratories were compared with median values for 2000–2006. Data from 20 participating laboratories were used to determine changes in season characteristics. ArcGIS software was used to document the annual geographic trend across the United States between 2000 and 2015. For season 2015–2016, data are available through April and are not included in the ArcGIS analysis. Results Nationally, there was a 53–93% reduction in rotavirus positivity in the post vaccine period as compared with the median in 2000–2006. Trends in rotavirus positivity declined steeply after vaccine introduction in 2006, and have remained low compared with the pre-vaccine period, with alternating years of lower and greater activity (figure). All regions had similar reductions in positive tests. ArcGIS data indicate that peak seasonal activity was largely restricted to January-April for each pre-vaccine year. In the 2006–2007 season, peak activity occurred during January-April, for 2007–2008, this shifted to March-April, for 2008–2009, the peak activity nationwide occurred at all months of the year from the reporting laboratories. This diffuse activity occurred for all subsequent years, save 2009–2010 and 2012–2013, where peak seasonal activity was again confined to January-April. Conclusion Rotavirus vaccine substantially and sustainably reduced the burden and changed the epidemiology of rotavirus in US children. The biennial pattern observed may be explained by accumulating unvaccinated children over two successive seasons resulting in stronger rotavirus seasons every alternate year. Disclosures All authors: No reported disclosures.
Journal Title: Open Forum Infectious Diseases
Year Published: 2017
Link to full text (if available)
Share on Social Media: Sign Up to like & get
recommendations!