Photo from wikipedia
Matching spatial entities (e.g., polygonal residential areas) from sources of significantly different map scales is challenging. The reason is that the same entities in two map scales have significant variations… Click to show full abstract
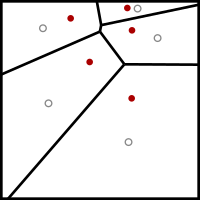
Matching spatial entities (e.g., polygonal residential areas) from sources of significantly different map scales is challenging. The reason is that the same entities in two map scales have significant variations in their positions, structure shapes and numbers, and topological relationships. Traditional matching methods based on minimum boundary rectangles (MBRs) or buffers usually lead to missed matches or mismatching. Furthermore, most of the previous approaches on entity similarity calculation are designed for datasets with specified map scales, which cannot directly apply to another set of dataset with a different scale. In this paper, we present a general approach using the Voronoi diagram for spatial entity matching on multi-scale datasets. Our approach first employs an efficient algorithm to construct the Voronoi diagram from the small-scale dataset. Next, the approach traverses each Voronoi polygon to find the corresponding large-scale features as the matching candidates (for each small-scale feature). Using the Voronoi diagram for identifying matching candidates does not require a manually determined search space (in contrast to the buffer-based approach). Also, our algorithm effectively uses the Voronoi diagram to prune the number of matching candidates even when the sources for matching contain large inconsistent position deviations. Finally, our approach utilizes three similarity indexes, namely, the convex hull shape similarity, convex hull area similarity, and overlapping area ratio to confirm the final matching results. We conducted experiments on two sets of datasets of two cities in China. The scales of the tested datasets were 1:10 000 and 1:50 000 and 1:1000 and 1:10 000. We compared our Voronoi-based method to both the MBR and buffer-based methods. The experiments showed that our method outperformed both the previous methods in generality and quality. Specifically, for the datasets where the inconsistent position deviations were large (i.e., the datasets of 1:1000 and 1:10 000 scales), the average F-measure of our results were 12.46%, 20.8%, and 64.45% higher than the MBR-based, 6-m buffer-based, and 3-m buffer-based methods, respectively.
Journal Title: IEEE Access
Year Published: 2018
Link to full text (if available)
Share on Social Media: Sign Up to like & get
recommendations!