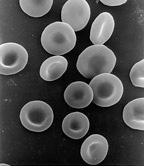
Photo from wikipedia
Brain artery velocities (Time-Averaged Maximum Mean Velocity, TAMMV) by Transcranial Doppler (TCD), hematocrit, hemoglobin, Red blood cell (RBC) Distribution Width (RDW) and RBC rigidity index (Ri), when reported together with… Click to show full abstract
Brain artery velocities (Time-Averaged Maximum Mean Velocity, TAMMV) by Transcranial Doppler (TCD), hematocrit, hemoglobin, Red blood cell (RBC) Distribution Width (RDW) and RBC rigidity index (Ri), when reported together with their correlations, provide a accurate and useful diagnostic picture than blood viscosity measurements alone. Additionally, our study included a sixth parameter provided by TCD, the Gosling Pulsatility Index PI, which is an indicator of CBF (Cerebral Blood Flow) resistance. All these parameters are routine in Hematology except for values of Ri. The rigidity (Ri) of the RBC is the main rheological characteristic of the blood of Sickle Cell Anemia (SCA) patients and several pathologies. However, its quantification depends on many commercial and experimental techniques, none disseminated and predominant around the World. The difference in absorbance values of the blood, during the process of sedimentation in a microwell of a Microplate Reader, is a straightforward way of semi-quantifying the RBC rigidity Ri, since the fraction of irreversibly sickled red blood cells does not form rouleaux. Erythrocyte Rigidity Index (Ri) was calculated using initial absorbance Ainitial (6 s) and final Afinal (540 s), Ri = 1 / (Ai-Af). The Ri of 119 patients (2-17 y / o, M & F) SCA, SCC (Sickle Cell/hemoglobin C), SCD (Sickle Cell/hemoglobin D), Sβ0thal (Sickle Cell/hemoglobin Beta Zero Thalassemia) and 71 blood donors (20-65 y / o, M & F) were measured in our laboratory while the five parameters (TAMMV and PI by TCD, Hct, Hb and RDW) were obtained from medical records. The in vitro addition of hydroxyurea (HU, 50mg /dl, n = 51 patients, and n = 8 healthy donors) in the samples decreased the rouleaux adhesion strength of both donor and patients' blood samples, leading to extraordinarily high Ri values. The correlation between the studied parameters was especially significant for the direct relationships between Ri, TAMMV, and PI.
Journal Title: PLOS ONE
Year Published: 2020
Link to full text (if available)
Share on Social Media: Sign Up to like & get
recommendations!