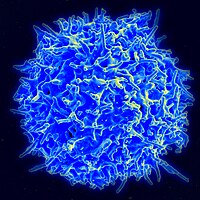
Photo from wikipedia
Background Primary nephrotic syndrome (PNS) is an immune-mediated glomerular disease that often reoccurs. However, the characteristics of circulating lymphocyte subsets in PNS children remain unclear. Immunosuppressive therapy can lead to… Click to show full abstract
Background Primary nephrotic syndrome (PNS) is an immune-mediated glomerular disease that often reoccurs. However, the characteristics of circulating lymphocyte subsets in PNS children remain unclear. Immunosuppressive therapy can lead to temporary or persistent remissions, but also increases the risk of infection, and whether the circulating lymphocyte subsets can be used to predict the secondary infection also remains unclear. Here, we explored the distribution of lymphocyte subpopulations in the different stages of PNS, and its predictive value of secondary infection in pediatric patients. Methods We included 89 children who were first PNS episodes or diagnosed with PNS admitted to Nanfang Hospital from September 2019 to April 2021, and 19 healthy children were recruited as controls (C). PNS patients were divided into three groups according to their serum biochemical tests: active group (A), partial remission (PR) group, and complete remission (CR) group. PNS patients with infection symptoms were divided into a co-infection group, others were divided into the non-infection group. The peripheral lymphocyte subsets were analyzed by flow cytometry. The relationship between the peripheral lymphocyte subsets and PNS activity or infection was analyzed. Results Compared to the healthy controls, the PNS patients’ CD8+CD28+ T cell (TC) (C: 16.6%, 450.8/µL; A: 29.1%, P=0.000, 886.1/µL, P=0.012; PR: 25.7%, P=0.000, 817.3/µL, P=0.012; CR: 24.9%, P=0.001, 747.9/µL, P=0.020), and CD4+CD45RO+ (“memory” helper) T cells (C: 13.2%, 358.9/µL; A: 15.7%, P=0.036, 578.7/µL, P=0.001; PR: 17.6%, P=0.002, 610.0/µL, P=0.000; CR: 13.7%, P=0.676, 398.1/µL, P=0.525) were elevated. In addition, the regulatory T cells counts (non-infection: 117.9/µL; Co-infection: 73.3/µL, P=0.001) were significantly lower in patients with infection. We found that the predictive value measured by the area under the curve (AUC) showed that the AUC (t) Treg cell counts (61.5–84.5%) were almost always higher than the AUC for the (t) CD4+ T cell counts (55.1–77.1%). Conclusions In this study, we found that T cell subpopulations had different characteristics in PNS during different disease phases. The CD8+CD28+ T cells, and CD4+CD45RO+ T cells increased at the disease quiescence of PNS. Moreover, CD4+ T cell subsets (regulatory T cell <82.5/µL) had higher predictive value than CD4+ T cell counts for PNS infection.
Journal Title: Translational Pediatrics
Year Published: 2022
Link to full text (if available)
Share on Social Media: Sign Up to like & get
recommendations!