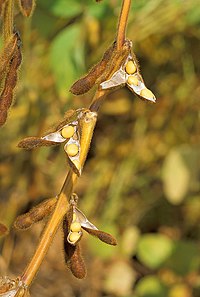
Photo from wikipedia
Agronomy Journa l • Volume 110 , I s sue 5 • 2018 Soybean [Glycine max (L.) Merr.] is considered as the main source for vegetable oil and animal protein… Click to show full abstract
Agronomy Journa l • Volume 110 , I s sue 5 • 2018 Soybean [Glycine max (L.) Merr.] is considered as the main source for vegetable oil and animal protein feed in the world (FAO, 2002). The United States (USA) and Argentina (ARG) account for more than 50% of the global soybean production (USDA-NASS, 2017). In the USA, more than 85% of the soybean area is in the Corn Belt region, where it is mainly planted in rotation with corn (Zea mays L.) (>60%). In ARG, soybean is primarily planted in the Rolling Pampas and Chaco regions, mainly after wheat (Triticum aestivum L.), and after corn to a lesser extent. Soybean yield potential (Yp) is genetically determined and attained under ideal conditions (genotype × environment × management practices, G × E × M), assuming no limitations in resources (e.g., water and nutrient supply) and in absence of any biotic (e.g., insects, diseases) and abiotic (e.g., temperature, drought, salinity) yield-limiting factors (Evans, 1993). Yield gap between Yp and actual farmer yield (YA) is primarily defined by the interacting effect between genotypes (material selection), the environment (soil + weather), and management practices (e.g., planting date, nutrient and pest management). A historical yield analysis for soybean showed that seed yield improved by 246% (1300 vs. 3200 kg ha–1) from the 1930s to 2010s (Balboa et al., 2018). Annual seed yield increases of 31 kg ha–1 in the USA (Specht et al., 1999) and 28 kg ha–1 globally (Wilcox, 2004) were reported from the 1970s to 2000s. As yield increased, a negative effect on seed protein was recorded by Rowntree et al. (2013), with a 0.19 g kg–1 yr–1 decrease in seed protein for maturity group (MG) II and 0.24 g kg–1 yr–1 decrease for MG III, from the 1920s and 2000s. Changes in seed yield and seed protein concentration were a consequence of both genetic (Boerma, 1979; Specht and Williams, 1984; Voldeng et al., 1997; Wilson et al., 2014; de Felipe et al., 2016) and management practices (Frederick et al., 1991; Heatherly and Elmore, 2004; Bastidas et al., 2008; Bradley and Sweets, 2008). Exploring Nitrogen Limitation for Historical and Modern Soybean Genotypes
Journal Title: Agronomy Journal
Year Published: 2018
Link to full text (if available)
Share on Social Media: Sign Up to like & get
recommendations!