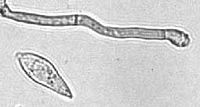
Photo from wikipedia
Rice is the staple food of more than half of the population of the world and India as well. One of the major constraints in rice production is frequent occurrence… Click to show full abstract
Rice is the staple food of more than half of the population of the world and India as well. One of the major constraints in rice production is frequent occurrence of pests and diseases and one of them is rice blast which often causes yield loss varying from 10 to 30%. Conventional approaches for disease assessment are time-consuming, expensive, and not real-time; alternately, sensor-based approach is rapid, non-invasive and can be scaled up in large areas with minimum time and effort. In the present study, hyperspectral remote sensing for the characterization and severity assessment of rice blast disease was exploited. Field experiments were conducted with 20 genotypes of rice having sensitive and resistant cultivars grown under upland and lowland conditions at Almora, Uttarakhand, India. The severity of the rice blast was graded from 0 to 9 in accordance to International Rice Research Institute (IRRI). Spectral observations in field were taken using a hand-held portable spectroradiometer in range of 350-2500 nm followed by spectral discrimination of different disease severity levels using Jeffires–Matusita (J-M) distance. Then, evaluation of 26 existing spectral indices (r≥0.8) was done corresponding to blast severity levels and linear regression prediction models were also developed. Further, the proposed ratio blast index (RBI) and normalized difference blast index (NDBI) were developed using all possible combinations of their correlations with severity level followed by their quantification to identify the best indices. Thereafter, multivariate models like support vector machine regression (SVM), partial least squares (PLS), random forest (RF), and multivariate adaptive regression spline (MARS) were also used to estimate blast severity. Jeffires–Matusita distance was separating almost all severity levels having values >1.92 except levels 4 and 5. The 26 prediction models were effective at predicting blast severity with R2 values from 0.48 to 0.85. The best developed spectral indices for rice blast were RBI (R1148, R1301) and NDBI (R1148, R1301) with R2 of 0.85 and 0.86, respectively. Among multivariate models, SVM was the best model with calibration R2=0.99; validation R2=0.94, RMSE=0.7, and RPD=4.10. The methodology developed paves way for early detection and large-scale monitoring and mapping using satellite remote sensors at farmers’ fields for developing better disease management options.
Journal Title: Frontiers in Plant Science
Year Published: 2023
Link to full text (if available)
Share on Social Media: Sign Up to like & get
recommendations!