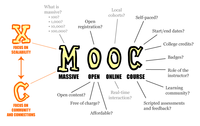
MOOC visual analytics: Empowering students, teachers, researchers, and platform developers of massively open online courses
Sign Up to like & getrecommendations! Published in 2017 at "Journal of the Association for Information Science and Technology"
DOI: 10.1002/asi.23852
Abstract: Along with significant opportunities, Massively Open Online Courses (MOOCs) provide major challenges to students (keeping track of course materials and effectively interacting with teachers and fellow students), teachers (managing thousands of students and supporting their… read more here.
Keywords: visual analytics; students teachers; open online; massively open ... See more keywords

Visual analytics of cellular signaling data
Sign Up to like & getrecommendations! Published in 2018 at "Multimedia Tools and Applications"
DOI: 10.1007/s11042-018-6966-5
Abstract: Cellular signaling data is a type of traffic data, which contains rich spatio-temporal information. Rather than studying the trajectories of individuals, we propose a visual analytics methodology to analyze the crowd flows among a geographical… read more here.
Keywords: visual analytics; methodology; analytics cellular; cellular signaling ... See more keywords

An Uncertainty Visual Analytics Framework for fMRI Functional Connectivity
Sign Up to like & getrecommendations! Published in 2018 at "Neuroinformatics"
DOI: 10.1007/s12021-018-9395-8
Abstract: Analysis and interpretation of functional magnetic resonance imaging (fMRI) has been used to characterise many neuronal diseases, such as schizophrenia, bipolar disorder and Alzheimer’s disease. Functional connectivity networks (FCNs) are widely used because they greatly… read more here.
Keywords: visual analytics; uncertainty visual; framework fmri; analytics framework ... See more keywords

VAUT: a visual analytics system of spatiotemporal urban topics in reviews
Sign Up to like & getrecommendations! Published in 2018 at "Journal of Visualization"
DOI: 10.1007/s12650-017-0464-0
Abstract: Online review platforms offer customers the opportunities to express valuable feedback and personal views from various aspects on restaurants, products, works of art, or other items. A majority of previous studies on these user-generated reviews… read more here.
Keywords: visual analytics; spatiotemporal urban; system; analysis ... See more keywords

OccVis: a visual analytics system for occultation data
Sign Up to like & getrecommendations! Published in 2019 at "Journal of Visualization"
DOI: 10.1007/s12650-018-00545-2
Abstract: The FY-3C satellite returns more than 250,000 occultation data each year, each of which records high vertical resolution profiles of various climatic parameters in the range of 0–1000 km above the Earth. These long-term, stable, and… read more here.
Keywords: visual analytics; occultation; occultation data; analytics system ... See more keywords

Visual analytics for nonlinear programming in robot motion planning
Sign Up to like & getrecommendations! Published in 2022 at "Journal of Visualization"
DOI: 10.1007/s12650-021-00786-8
Abstract: Abstract Nonlinear programming is a complex methodology where a problem is mathematically expressed in terms of optimality while imposing constraints on feasibility. Such problems are formulated by humans and solved by optimization algorithms. We support… read more here.
Keywords: visual analytics; motion planning; nonlinear programming; robot motion ... See more keywords

A Correlation Visual Analytics System for Air Quality
Sign Up to like & getrecommendations! Published in 2018 at "Chinese Journal of Electronics"
DOI: 10.1049/cje.2018.04.013
Abstract: A visual analytics system is proposed to reveal the lead/lag correlation when air pollution is detected. In this system, an Overview + Detail approach is utilized for analyzing the correlation of air quality under both… read more here.
Keywords: visual analytics; system; correlation; analytics system ... See more keywords

Design and Implementation of a Visual Analytics Electronic Antibiogram within an Electronic Health Record System at a Tertiary Pediatric Hospital
Sign Up to like & getrecommendations! Published in 2018 at "Applied clinical informatics"
DOI: 10.1055/s-0037-1615787
Abstract: BACKGROUND Hospitals use antibiograms to guide optimal empiric antibiotic therapy, reduce inappropriate antibiotic usage, and identify areas requiring intervention by antimicrobial stewardship programs. Creating a hospital antibiogram is a time-consuming manual process that is typically… read more here.
Keywords: visual analytics; electronic health; hospital; health record ... See more keywords

Deep Learning for Visual Analytics of the Spread of COVID-19 Infection in Crowded Urban Environments
Sign Up to like & getrecommendations! Published in 2021 at "Natural Hazards Review"
DOI: 10.1061/(asce)nh.1527-6996.0000492
Abstract: AbstractThe novel SARS-CoV-2 coronavirus caused a global pandemic in 2020 with millions of diagnosed cases and a staggering number of deaths. As a preventive measure, many governments issued social... read more here.
Keywords: visual analytics; learning visual; analytics spread; spread covid ... See more keywords

Predicting the visualization intensity for interactive spatio-temporal visual analytics: a data-driven view-dependent approach
Sign Up to like & getrecommendations! Published in 2017 at "International Journal of Geographical Information Science"
DOI: 10.1080/13658816.2016.1194424
Abstract: ABSTRACT The continually increasing size of geospatial data sets poses a computational challenge when conducting interactive visual analytics using conventional desktop-based visualization tools. In recent decades, improvements in parallel visualization using state-of-the-art computing techniques have… read more here.
Keywords: visual analytics; visualization intensity; visualization; data driven ... See more keywords

Visual Analytics for the Coronavirus COVID-19 Pandemic
Sign Up to like & getrecommendations! Published in 2022 at "Big data"
DOI: 10.1089/big.2021.0023
Abstract: The coronavirus disease COVID-19 was first reported in Wuhan, China, on December 31, 2019. The disease has since spread throughout the world, affecting 227.2 million individuals and resulting in 4,672,629 deaths as of September 9,… read more here.
Keywords: coronavirus covid; disease; visual analytics; covid pandemic ... See more keywords