UCSF ChimeraX: Meeting modern challenges in visualization and analysis
Sign Up to like & getrecommendations! Published in 2018 at "Protein Science"
DOI: 10.1002/pro.3235
Abstract: UCSF ChimeraX is next‐generation software for the visualization and analysis of molecular structures, density maps, 3D microscopy, and associated data. It addresses challenges in the size, scope, and disparate types of data attendant with cutting‐edge… read more here.
Keywords: chimerax; chimerax meeting; visualization analysis; ucsf chimerax ... See more keywords

A Method for Cross-Species Visualization and Analysis of RNA-Sequence Data.
Sign Up to like & getrecommendations! Published in 2018 at "Methods in molecular biology"
DOI: 10.1007/978-1-4939-7456-6_14
Abstract: In this methods article, I describe a computational workflow for cross-species visualization and comparison of mRNA-seq transcriptome profiling data. The workflow is based on gene set variation analysis (GSVA) and is illustrated using commands in… read more here.
Keywords: visualization analysis; species visualization; cross species; method cross ... See more keywords

Visualization analysis of the development trajectory of knowledge sharing in virtual communities based on CiteSpace
Sign Up to like & getrecommendations! Published in 2018 at "Multimedia Tools and Applications"
DOI: 10.1007/s11042-018-6061-y
Abstract: Studies on knowledge sharing (KS) in virtual communities (VCs) have indicated several limitations, such as chaotic literature information, interdisciplinarity complexity, and evolution vagueness. In this study, literature on KS in VCs is obtained from the… read more here.
Keywords: knowledge sharing; sharing virtual; visualization analysis; analysis development ... See more keywords

Interactive visualization and analysis of morphological skeletons of brain vasculature networks with VessMorphoVis
Sign Up to like & getrecommendations! Published in 2020 at "Bioinformatics"
DOI: 10.1093/bioinformatics/btaa461
Abstract: Abstract Motivation Accurate morphological models of brain vasculature are key to modeling and simulating cerebral blood flow in realistic vascular networks. This in silico approach is fundamental to revealing the principles of neurovascular coupling. Validating… read more here.
Keywords: interactive visualization; analysis; visualization; brain vasculature ... See more keywords

APL@voro—interactive visualization and analysis of cell membrane simulations
Sign Up to like & getrecommendations! Published in 2023 at "Bioinformatics"
DOI: 10.1093/bioinformatics/btad083
Abstract: Abstract Summary Molecular dynamics (MD) simulations of cell membranes allow for a better understanding of complex processes such as changing membrane dynamics, lipid rafts and the incorporation/passing of macromolecules into/through membranes. To explore and understand… read more here.
Keywords: cell membrane; apl voro; interactive visualization; membrane ... See more keywords

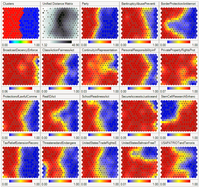
Seismic Facies Visualization Analysis Method of SOM Corrected by Uniform Manifold Approximation and Projection
Sign Up to like & getrecommendations! Published in 2023 at "IEEE Geoscience and Remote Sensing Letters"
DOI: 10.1109/lgrs.2023.3260105
Abstract: As a common seismic facies visualization analysis method, self-organizing map (SOM) projects the waveform or seismic attribute vectors into a two-dimensional topological plane in a nonlinear way, which can effectively and efficiently discover the topological… read more here.
Keywords: facies visualization; visualization; structure; analysis method ... See more keywords

A Structured Review of Data Management Technology for Interactive Visualization and Analysis
Sign Up to like & getrecommendations! Published in 2021 at "IEEE Transactions on Visualization and Computer Graphics"
DOI: 10.1109/tvcg.2020.3028891
Abstract: In the last two decades, interactive visualization and analysis have become a central tool in data-driven decision making. Concurrently to the contributions in data visualization, research in data management has produced technology that directly benefits… read more here.
Keywords: data management; visualization analysis; interactive visualization; visualization ... See more keywords

State‐of‐the‐art in Multi‐Light Image Collections for Surface Visualization and Analysis
Sign Up to like & getrecommendations! Published in 2019 at "Computer Graphics Forum"
DOI: 10.1111/cgf.13732
Abstract: Multi‐Light Image Collections (MLICs), i.e., stacks of photos of a scene acquired with a fixed viewpoint and a varying surface illumination, provide large amounts of visual and geometric information. In this survey, we provide an… read more here.
Keywords: analysis; visualization; light image; visualization analysis ... See more keywords

Visualization in analysis: developing ANT Analysis Diagrams (AADs)
Sign Up to like & getrecommendations! Published in 2017 at "Qualitative Research"
DOI: 10.1177/1468794116661229
Abstract: This article presents a novel diagramming approach which employs aspects of Actor-Network Theory (ANT) in the creation of ANT Analysis Diagrams (AADs). ANT is a socio-material approach which allows for the consideration of both human… read more here.
Keywords: analysis diagrams; ant analysis; diagrams aads; analysis ... See more keywords

Visualization Analysis of Research on Rice with Fertilizer from the ‘Agronomy’ Category based on Citespace
Sign Up to like & getrecommendations! Published in 2019 at "Current Science"
DOI: 10.18520/cs/v117/i9/1449-1458
Abstract: CURRENT SCIENCE, VOL. 117, NO. 9, 10 NOVEMBER 2019 1449 Jie Sun is in the Library of Huazhong Agricultural University and Bao-Zhong Yuan is in the College of Plant Science and Technology, Huazhong Agricultural University,… read more here.
Keywords: agronomy category; rice fertilizer; research rice; visualization analysis ... See more keywords

GraphBio: A shiny web app to easily perform popular visualization analysis for omics data
Sign Up to like & getrecommendations! Published in 2022 at "Frontiers in Genetics"
DOI: 10.3389/fgene.2022.957317
Abstract: Summary Here, we present GraphBio, a shiny web app to easily perform visualization analysis for omics data. GraphBio provides 15 popular visualization analysis methods, including heatmap, volcano plots, MA plots, network plots, dot plots, chord… read more here.
Keywords: easily perform; graphbio shiny; analysis; popular visualization ... See more keywords